Divorce Rate in America
Debunking the Myth that 50% of Marriages End in Divorce
The claim that 50% of marriages end in divorce is a widely circulated statistic, often repeated in casual conversation and the media. However, this figure is a relic of projections from the 1970s, a time when divorce rates surged following the introduction of no-fault divorce laws. Today, the reality is more complex, with divorce rates declining and varying significantly by region, age, education, and economic conditions. Using the most recent data available as of 2025, this article updates the narrative, offering a clearer picture of marriage and divorce trends in the United States.
How many people are really getting divorced in the US?
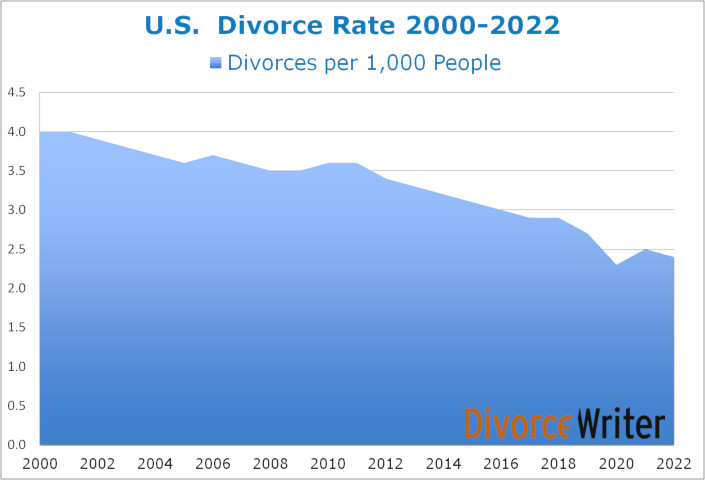
To understand the prevalence of divorce, one useful metric is the crude divorce rate, which measures the number of divorces per 1,000 people. According to the Centers for Disease Control and Prevention (CDC), the crude divorce rate in 2022 was 2.4 per 1,000 people, a notable decrease from 4.0 in 2000. This decline reflects broader societal shifts, including fewer marriages and changing attitudes toward relationships.
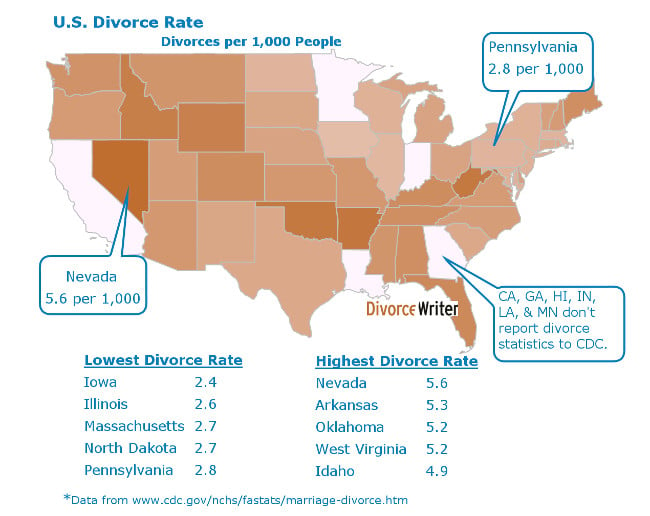
Divorce rates vary significantly by state, influenced by local marriage rates, cultural norms, and legal frameworks. The following table summarizes the highest and lowest divorce rates by state in 2022, based on data from the U.S. Census Bureau:
In 2022, Arkansas led with the highest divorce rate at 11.9 per 1,000 women, followed by Wyoming at 11.0. Conversely, Vermont had the lowest rate at 4.6, with Puerto Rico close behind at 5.1. Notably, states like Nevada, which historically had high divorce rates due to lenient marriage and divorce laws, have seen declines, with Nevada reporting 4.2 in 2021 (worldpopulationreview.com). These figures exclude data from states like California, Hawaii, Indiana, Minnesota, and New Mexico, which do not consistently report divorce statistics, complicating national estimates.
What is the actual divorce rate, then?
While the crude divorce rate offers a snapshot of divorce frequency, many people want to know the percentage of marriages that end in divorce. Calculating this is challenging because comparing annual marriages to divorces in the same year mixes different groups—those marrying are not typically the same as those divorcing. Moreover, incomplete state reporting, particularly from large states like California, hinders precise calculations.
Recent surveys provide a clearer estimate. Based on data from the CDC and U.S. Census Bureau, approximately 42% of first marriages are likely to end in divorce, a figure supported by sources like Forbes Advisor. This is lower than the 50% myth but higher than earlier survey estimates according to the U.S. Census Bureau's Survey of Income and Program Participation from 2009, which suggested around 31%. The 42% figure accounts for divorces only and excludes separations due to spousal death, which can inflate non-married statistics.
Other surveys align closely with this estimate:
- A 2021 study cited by Forbes Advisor reported 43% for first marriages.
- The American Psychological Association estimated 41% for 2025 projections.
Divorce Rate and Age
Divorce rates vary across age groups, reflecting generational differences in marriage patterns. Younger generations, particularly Millennials, exhibit lower divorce rates, largely because they marry later or opt for cohabitation over marriage. Marrying later is associated with greater relationship stability, as older couples often have more financial security and maturity.
In contrast, older adults are experiencing a rise in "gray divorce," defined as divorce among those aged 50 and older. According to Pew Research, the divorce rate for adults 50 and older doubled from 5 per 1,000 married persons in 1990 to 10 in 2015, with those 65 and older seeing a tripling to 6 per 1,000. This trend, driven by Baby Boomers, continues, fueled by longer life expectancies, increased financial independence for women, and shifting social attitudes toward divorce.
The following factors contribute to lower divorce rates among younger generations:
- Delayed Marriage: Millennials often marry in their late 20s or 30s, reducing divorce risk by 24% for those marrying after 25.
- Cohabitation: Couples who cohabitate before marriage may face a 40% higher divorce risk, but many avoid marriage altogether, lowering formal divorce statistics.
Divorce Rate and Education
Education level remains a strong predictor of divorce risk. Couples with higher education levels are less likely to divorce, a trend consistent with findings from the U.S. Census Bureau and Pew Research. College-educated individuals benefit from greater financial stability and communication skills, reducing divorce likelihood by approximately 13% compared to high school dropouts.
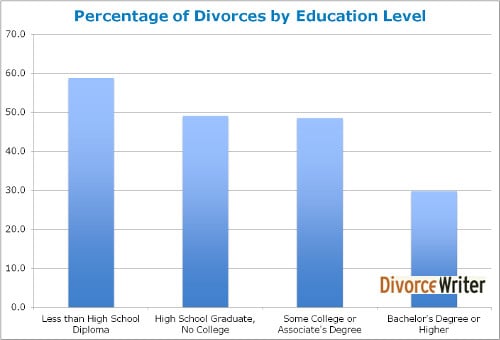
This pattern holds across age groups, with educated couples by age 46 showing lower divorce rates than their less-educated counterparts. The stability afforded by education underscores its role in fostering resilient marriages.
Divorce Rate and the Economy
The relationship between divorce rates and economic conditions is complex and often debated. Research suggests that divorce rates typically decline during economic recessions and rise during recoveries. For example, during the recession of 2008-2009, divorce rates dropped as couples faced financial constraints, making separation less feasible. The COVID-19 pandemic also saw a 12% reduction in divorce counts from 2020 to 2022, attributed to economic and social uncertainties.
However, whether economic hardship strengthens relationships or merely delays inevitable divorces is unclear. Lower-income individuals face higher divorce rates (39%) due to financial stress, while economic stability correlates with lower rates among upscale adults. This suggests that economic factors influence the timing of divorces more than their occurrence.
Divorce Rate and Second Marriages
Data on second and subsequent marriages is less comprehensive, but estimates indicate higher divorce risks. Approximately 60% of second marriages and 73% of third marriages end in divorce, according to Forbes Advisor and Graziano & Flynn. These figures, while consistent with earlier estimates, rely on limited survey data, as national reporting on subsequent marriages is sparse.
The higher divorce rates for second marriages may stem from complex factors, such as blended family dynamics or differing expectations. The U.S. Census Bureau notes that only 6% of divorced couples remarry each other, indicating that most seek new partners, potentially carrying unresolved issues into subsequent unions.
Same-Sex Divorce Rates
On average, approximately 2% of same-sex couples in the U.S. dissolve their legal partnerships annually, a rate comparable to or slightly lower than the divorce rate for married different-sex couples, which stands at about 2.4 per 1,000 people in 2022. Recent studies indicate that lesbian couples tend to have higher divorce rates than gay male couples, though precise figures for 2023–2025 are not consistently reported.
For example, in 2018, the National Center for Health Statistics reported 782,038 total divorces, with same-sex divorces estimated at 5% to 6% of same-sex couples, though specific breakdowns by gender were not provided. More recent data from 2019, cited in studies, suggests that of same-sex divorces, lesbian couples accounted for roughly 72% compared to 28% for gay male couples, despite women representing 56% of same-sex marriages. Gay men, comprising about 46.6% of same-sex marriages in 2019, made up a smaller share of divorces. Lesbian couples, who often move more quickly from dating to marriage and are more likely to have prior marriages, may face higher divorce rates, with estimates suggesting 18% of women in same-sex civil partnerships were previously divorced, compared to 10% of men. Updated 2023–2025 data on this specific trend is sparse, but the pattern of higher lesbian divorce rates persists in available studies.
To Sum It All Up
The myth that 50% of marriages end in divorce oversimplifies a complex reality. Current estimates suggest that about 42% of first marriages end in divorce, with rates declining overall but varying by state, age, education, and economic conditions. Arkansas and Wyoming lead in divorce rates, while Vermont and Puerto Rico report the lowest. Younger generations divorce less, while older adults face rising "gray divorce" rates. Higher education and economic stability reduce divorce risks, but second and third marriages face significantly higher challenges.
Understanding these trends requires acknowledging the limitations of available data, particularly for subsequent marriages and non-reporting states. By debunking the 50% myth, we can foster a more informed discussion about marriage and divorce in the U.S., grounded in the latest evidence.
See Also

© 2026 Pro Se Planning, Inc. All rights reserved.